

By Chris Horner
The Washington Post has a predictable, propagandistic lead Monday editorial - “Climate change underscored: A new report leaves little room for doubt” - that merits a fisking for the prominence given such admittedly non-newsy, if wildly spun and internally inconsistent, repetitiveness (emphases added throughout):
“CLIMATE CHANGE is occurring, is very likely caused by human activities, and poses significant risks for a broad range of human and natural systems.”
So says - in response to a request from Congress - the National Research Council of the National Academy of Sciences, the country’s preeminent institution chartered to provide scientific advice to lawmakers.
Ah, so - the implication is clear - it is a panel of scientists; wait, not just scientists, but climate scientists, and worthy of description as ‘preeminent’. But, then, the piece continues oddly without elaboration on this hint:
In a report titled “America’s Climate Choices,” a panel of scientific and policy experts also concludes that the risks of inaction far outweigh the risks or disadvantages of action.
Well, as Hoover fellow Paul Gregory notes, prompted by similar slop from the New York Times, “Of the first eight names, only one appears to be a climate scientist. The others are engineers, lawyers, and public policy types”.
But of course, we’re used to these gents being railroad engineers (the IPCC’s chief scientist, Rajendra Pachauri) and anthropology teaching assistants (see the IPCC ‘world’s leading climate scientists’![]() . By the next paragraph, however, surely the reader would begin wondering what is such a panel of scientists doing making these recommendations, which are in fact policy calls?
. By the next paragraph, however, surely the reader would begin wondering what is such a panel of scientists doing making these recommendations, which are in fact policy calls?
And the most sensible and urgently needed action, the panel says, is to put a rising price on carbon emissions, by means of a tax or cap-and-trade system. That would encourage innovation, research and a gradual shift away from the use of energy sources (oil, gas and coal) that are endangering the world.
Slippery, slippery. We need not belabor the ‘what if a skeptic trotted out such an ‘expert climate panel’ argument here. It’s just too obvious.
None of this should come as a surprise. None of this is news. But it is newsworthy, sadly, because the Republican Party, and therefore the U.S. government, have moved so far from reality and responsibility in their approach to climate change.
Oh. So it was the Republican-controlled Senate, with 60 and then 59 Democrat Senators, which refused to take up the issue last Congress? No. Just like the opposition in the House, then and now, Senate opposition is bipartisan, and strongly so. Though you’d never know that from reading the hyper-political WaPo:
Seizing on inevitable points of uncertainty in something as complex as climate science, and on misreported pseudo-scandals among a few scientists, Republican members of Congress, presidential candidates and other leaders pretend that the dangers of climate change are hypothetical and unproven and the causes uncertain.
Not so, says the National Research Council. “Although the scientific process is always open to new ideas and results, the fundamental causes and consequences of climate change have been established by many years of scientific research, are supported by many different lines of evidence, and have stood firm in the face of careful examination, repeated testing, and the rigorous evaluation of alternative theories and explanation.”
Climate-change deniers, in other words, are willfully ignorant, lost in wishful thinking, cynical or some combination of the three.
Ah, yes, ‘certainty’, and name-calling to prove the point. But then, as Jacobs, seizing on uncertainty also pointed out:
“The report tells us… the science is far from certain. I quote: ‘How will the climate system respond to increased greenhouse gases? The exact value of “climate sensitivity” - that is, how much temperature rise will occur for a given increase in atmospheric greenhouse gas concentration - is uncertain due to incomplete understanding of some elements of the earth’s climate system.’ Note the wobbly use of language, such as “exact” or “some elements,” to signal that the science is “almost certain.” I can imagine the illustrious committee members searching for appropriate qualifiers that would not let the cat out of the bag.
In fact, climate sensitivity to doubling of atmospheric carbon dioxide concentrations is fairly summarized as the whole shootin’ match of the climate issue. Computer models on which policy types base their demands (and alarmists their prophesying) assume a climate sensitivity that is vastly greater than the les policy-relevant observations. You might know the latter as ‘reality’.
This group-grope “is not a study of climate science but of risk management”, per Jacobs, although I must add it is one accepting fairly well disproved assumptions (key among them: the climate’s sensitivity), which in itself is highly problematic.
I could go on. Because the Post surely did. But the point is that all of the tired name-calling and hyperventilation gets no more compelling the fifth or fiftieth time it is trotted out. These people demand a terrible imposition on society for no detectable climate impact. Let alone the subjective idea of ‘gain’ (as warming has historically been beneficial, indeed called a ‘climate optimum’.
But outlets like the Washington Post and its editorial board have always had a difficult time with good news. It’s just not news at all. Sort of like the NRC ‘report’ WaPo flogs, as it does each and every such one. Meanwhile, the sky remains just where we left it.
As just pointed out by an astute and disillusioned young climate scientist, James Hansen, the high priest of the global warming religion and defender of creation has recently produced a non-peer-reviewed paper finding that the net man-made effects on climate have been greatly exaggerated by computer models. Hansen claims most climate models have underestimated the cooling effect of man-made aerosols via cloud changes, although the fine print in the paper admits they really have no idea what is causing the cloud changes and resulting cooling effect. Hmmm, possibly the cosmic ray theory of Svensmark et al? Hansen also references estimates for climate sensitivity pulled out of the air by his brainwashed grandchildren in the amusing paper (p. 3).
Earth’s Energy Imbalance and Implications
James Hansen (1), Makiko Sato (1), Pushker Kharecha (1), Karina von Schuckmann (2)
((1) NASA Goddard Institute for Space Studies and Columbia University Earth Institute, (2) Centre National de la Recherche Scientifique)
(Submitted on 5 May 2011)
Improving observations of ocean temperature confirm that Earth is absorbing more energy from the sun than it is radiating to space as heat, even during the recent solar minimum. The inferred planetary energy imbalance, 0.59 \pm 0.15 W/m2 during the 6-year period 2005-2010, provides fundamental verification of the dominant role of the human-made greenhouse effect in driving global climate change. Observed surface temperature change and ocean heat gain constrain the net climate forcing and ocean mixing rates. We conclude that most climate models mix heat too efficiently into the deep ocean and as a result underestimate the negative forcing by human-made aerosols. Aerosol climate forcing today is inferred to be -1.6 \pm 0.3 W/m2, implying substantial aerosol indirect climate forcing via cloud changes. Continued failure to quantify the specific origins of this large [negative] forcing is untenable, as knowledge of changing aerosol effects is needed to understand future climate change. A recent decrease in ocean heat uptake was caused by a delayed rebound effect from Mount Pinatubo aerosols and a deep prolonged solar minimum. Observed sea level rise during the Argo float era can readily be accounted for by thermal expansion of the ocean and ice melt, but the ascendency of ice melt leads us to anticipate a near-term acceleration in the rate of sea level rise.
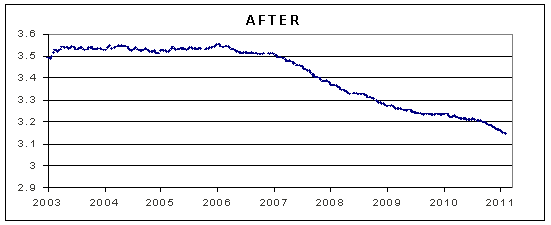
Sorry Jimbo, near-term sea level rise is decelerating
Sea level rise is accelerating...to the downside
Following a long delay and some controversial “adjustments,” the University of Colorado sea level satellite data was recently released. A plot of the rate of sea level rise shows a stable rate between 2003 and 2007, and declining rates since 2007.
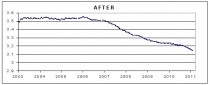
Rate of sea level rise in mm/year
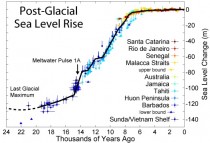
Sea levels have been rising since the peak of the last ice age 22,000 years ago and have been decelerating over the past 8,000 years.
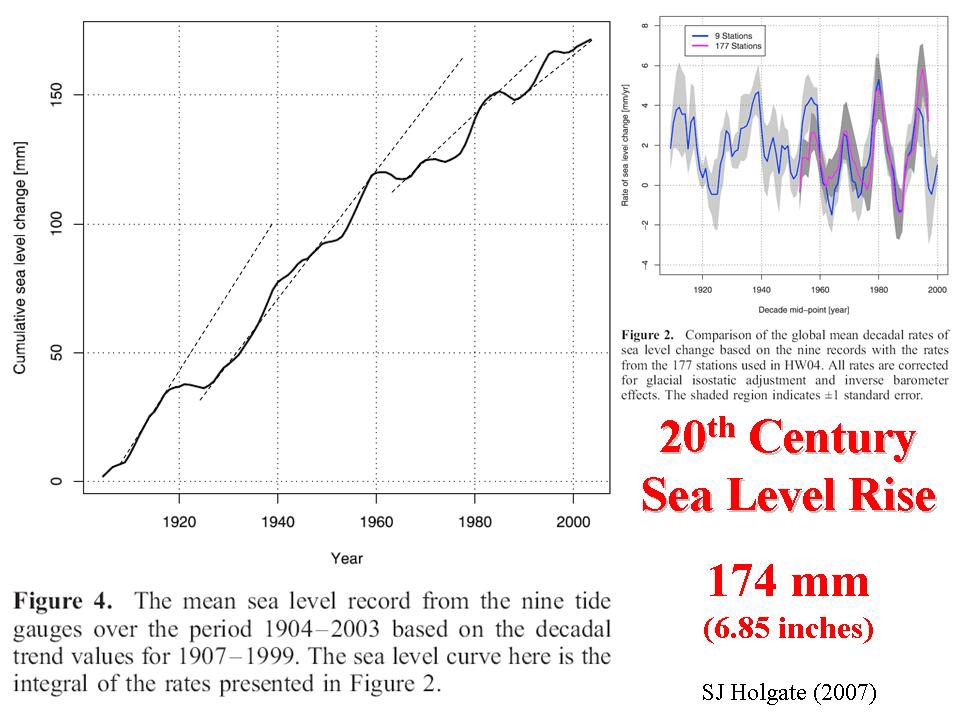
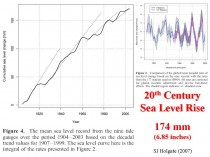
See also Inconvenient Truth: Sea Level Rise is Decelerating for evidence that the rate of sea level rise also decelerated in the 20th century. Holgate’s analysis is shown below (enlarged here).
Icecap Note: The first paper using output from the Surface Station project of Anthony Watts’s is accepted for publication. Kudos to Anthony, Roger Pielke Sr. and the other authors. Here is one of the co-author’s view. John Neilson Gammon is the State climatologist for Texas. He is NOT a skeptic but a true scientist who takes fair and objective views of the data.
By John Nielsen-Gammon, Climate Abyss
As you may have heard, the long-awaited peer-reviewed analysis of the results of the SurfaceStations.org project has finally been released. I can’t wait to see the dueling headlines. Some will argue that the take-home message should be: Poor Station Siting Strongly Effects Temperature Trend Measurements, and will laugh at the idea that we can say with sufficient accuracy what has happened to our climate. Others will argue that the take-home message should be: Poor Station Siting Has No Effect on Temperature Trend Measurements, and will laugh at all the effort expended on a null result. Both sides will find solid evidence for their points of view in the paper. How can that be? How can one paper support opposing conclusions?
First off, when you see a plot of historic temperature anomalies averaged over the United States or over the globe, you’re almost certainly looking at something derived from “mean temperatures”. The daily mean temperature is simply the average of the maximum and minimum temperatures.
Siting issues will affect maximum and minimum temperatures differently. For example, a shade tree overhanging the instrument shelter will make the maximum temperatures cooler and the minimum temperatures warmer. An air conditioner near the instrument shelter will make both maximum and minimum temperatures warmer, but probably have the biggest effect on minimum temperatures.
It’s possible that such siting problems might alter the temperature trend measured at a particular station, but clearly there will be a big effect if the siting characteristics change over time. Add an air conditioning unit, and temperatures go up. Add a tree, and the diurnal temperature range (the difference between the daily maximum and minimum temperatures) goes down.
Big siting changes started in the late 1980s, as the thermometer of choice went from a standard liquid-in-glass thermometer to MMTS, a sensor that required electricity. Quite frequently, the measurement site ended up closer to buildings because that’s where the electricity was.
In an ideal world, you’ll have records of all these changes, and you’ll have observations taken simultaneously at the old and new sites so that you’ll know what difference it makes. But as you may have noticed, ours is not an ideal world.
Correcting for such changes is a job that falls to the National Climatic Data Center (NCDC). Their techniques for making adjustments to the data to correct for such problems have become more and more sophisticated over the years. First, they make the obvious correction for time-of-observation bias (if your daily observation time is in the afternoon, you’ll double-count maxes; if it’s in the morning, you’ll double-count mins), then the rest of it is based on comparing a station to its neighbors and looking for sudden jumps or steadily diverging records. If the difference is big enough, they estimate the difference and adjust for it; “big enough” is fairly small if the jump happens to coincide with a documented change of the station characteristics, but the bar is set higher if there was no known change.
The Fall et al. 2011 paper used the SurfaceStations.org ratings of the quality of the individual USHCN stations and asked some basic questions: Does the temperature measured at a site depend on the siting quality? Does the trend measured over time depend on siting quality? Do the NCDC adjustments correct for differences in siting quality? Note that Fall et al. didn’t attempt to distinguish from effects due to siting quality itself and effects due to instrument changes, nor did they look at larger-scale effects like urbanization.
Here, in brief, are the answers: The poorest sites tend to be warmer. The minimum temperatures are warming faster at poorer sites than at better sites. The maximum temperatures are warming slower at poorer sites than at better sites. The adjustments reduce the differences by about half. The two effects are roughly equal and opposite so the mean temperature is rising at about the same rate across sites of different quality while the diurnal temperature range shows the biggest difference across sites.
On the one hand, this seems to be confirmation of the quality of the temperature record. All types of sites show the same mean temperature trend, so there’s no change necessary to our estimates of observed historical temperature trends in the United States.
On the other hand, there are several warning flags raised by this study. First, station siting is indeed important for the maximum and minimum temperature measurements. Second, the adjustments are only partly correcting the temperature record. Third, since the adjustments use data from all surrounding stations, there’s the danger that the mean trends are dominated by data from the poorer stations. (Less than ten percent of the USHCN stations are sited well enough to be considered appropriate for climate trend measurements.) Finally, and perhaps most important, are we really so lucky that the rest of the world would also have its poorly-sited stations have erroneous maximum and minimum temperature trends that just happen to be equal and opposite to each other?
So if you thought that the temperature record in the US was lousy, well for mean temperatures in particular it may not be too bad. (Note: regional conditions may vary.) And if you thought that the adjusted station data had eliminated effects due to poor siting, well for most temperature variables there’s still a ways to go. I’m glad we now have the Climate Reference Network, which should at least guarantee accurate trend measurements going forward.
By the way, if you’ve downloaded the paper you may have noticed that I’m one of the authors. My involvement was mainly in the statistical analysis, and I’ll discuss the statistics of the paper in another post. There’s also a lot more in the paper than my brief summary implies, and I’ll go into some of those issues later too.